Experiments#
An experiment runs a prompt across a dataset, a sweep of settings and a set of model profiles, and scores every result.
The matrix is profiles × sweep trials × dataset rows. That one shape covers a prompt A/B test, a model comparison and a hyperparameter search.
Setting one up#
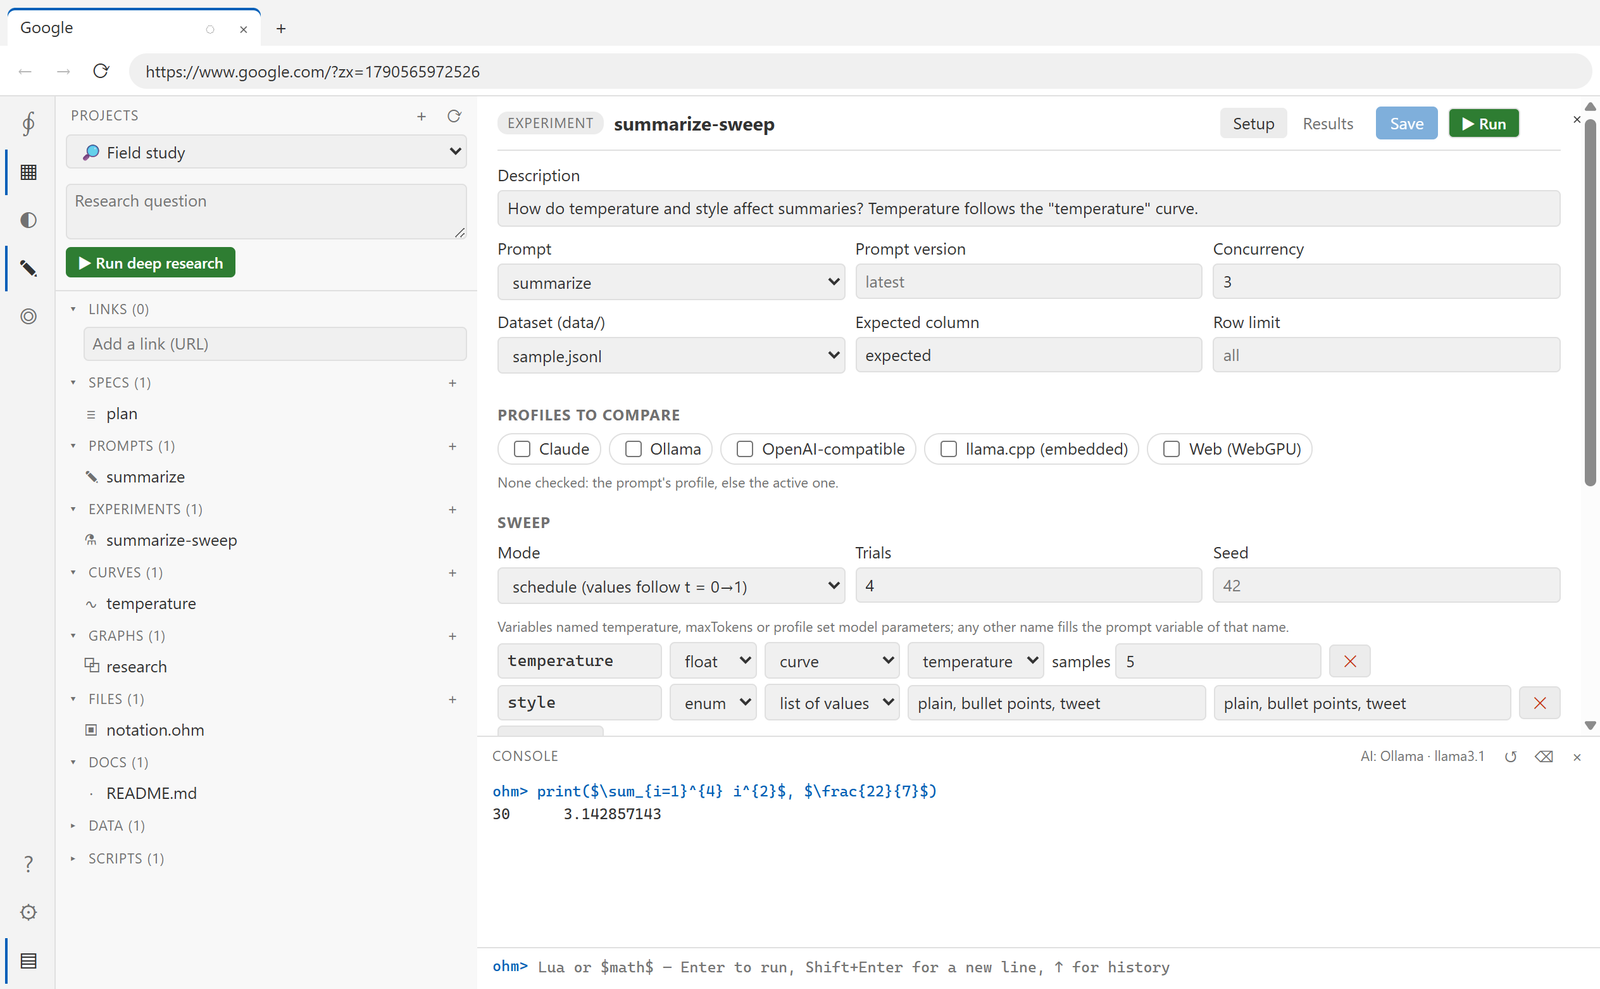
Prompt — pick one and optionally pin a version.
Dataset — a file in the project's
data/folder:.jsonl— one JSON object per line.json— an array of objects.csv— quoted fields and""escapes supported- anything else — one
{ text = line }per line
Set
expectedColumnto name the column holding the reference answer, andlimitto cap the rows. With no dataset at all the experiment runs one empty row, which is what you want for a pure sweep.Profiles — one or more model profiles to compare.
Sweep — see below.
Evaluators — how each result is scored.
Sweeps#
A sweep variable is a name plus a source:
| Source | Meaning |
|---|---|
const |
one fixed value |
values |
a list to walk |
range |
min…max by step, or count evenly (or logarithmically) spaced points |
random |
sampled from a range |
curve |
sampled from one of the project's curves |
Three names are reserved and set model parameters instead of prompt variables:
temperature, maxTokens and profile. Everything else fills a prompt variable.
Three modes:
- grid — every combination, last variable varying fastest. The count is checked against a
limit before anything runs, and a
randomsource here is an error rather than a silent sample. - random — N trials drawn from a seeded RNG (default seed 42, so runs reproduce).
- schedule — N trials where each variable follows its position
t = i/(n−1).
In random mode, curve-backed variables still follow the schedule — so "random search with an annealed temperature" is a single experiment.
The editor previews the first trials and shows the resulting call count before you start.
Evaluators#
| Type | Scores |
|---|---|
exact |
normalised equality |
contains |
fraction of the expected terms present; passes only when all are |
regex |
a pattern against the output |
similarity |
1 − edit distance / length, passing at a threshold (default 0.8) |
json |
the output parses as JSON (a ```json fence is unwrapped first) |
length |
character count within a range |
llm_judge |
a model grades against a rubric, 0–10, mapped to 0…1 |
Each has a weight; the case score is the weighted mean, and a case passes only when every evaluator passes.
An experiment with no evaluators reports every case as passing with a perfect score. Add at least one, or read the leaderboard as latency-only.
Running#
Ohm refuses to start if the matrix would exceed 5000 model calls, and tells you the number — so a mis-set range costs nothing. Rows run through a small worker pool (3 by default).
Progress is live and a run can be cancelled; cancellation takes effect between cases, since a generation already in flight cannot be stopped.
Results#
Each run is one file under experiments/<name>.runs/, so results are inspectable and
diffable.
The view shows a leaderboard — average score and pass rate per trial — and a table of rank, profile, parameters, average score, pass rate, p50 and p95 latency and error count. Percentiles are nearest-rank, not interpolated. Drill into any trial to see each case's input, output, expected answer and per-evaluator scores.
From a script#
local run = experiments.run("summarize-sweep")
print(run.status, #run.trials)
for _, t in ipairs(run.trials) do print(t.summary.avgScore, t.summary.passRate) end