Graphs#
The graph editor is a node canvas for building pipelines visually. A graph compiles to an Ohm script — it does not run itself — so you can read, edit and rerun the generated code, and there is only ever one execution engine.
Graphs live in graphs/<name>.graph.json and open from the Projects panel. Rete.js and its
plugins are bundled locally; nothing is fetched from a CDN.
Building a pipeline#
Drag components from the palette, connect an output to an input, and fill in the controls on each node. Sockets are untyped, so anything can feed anything.
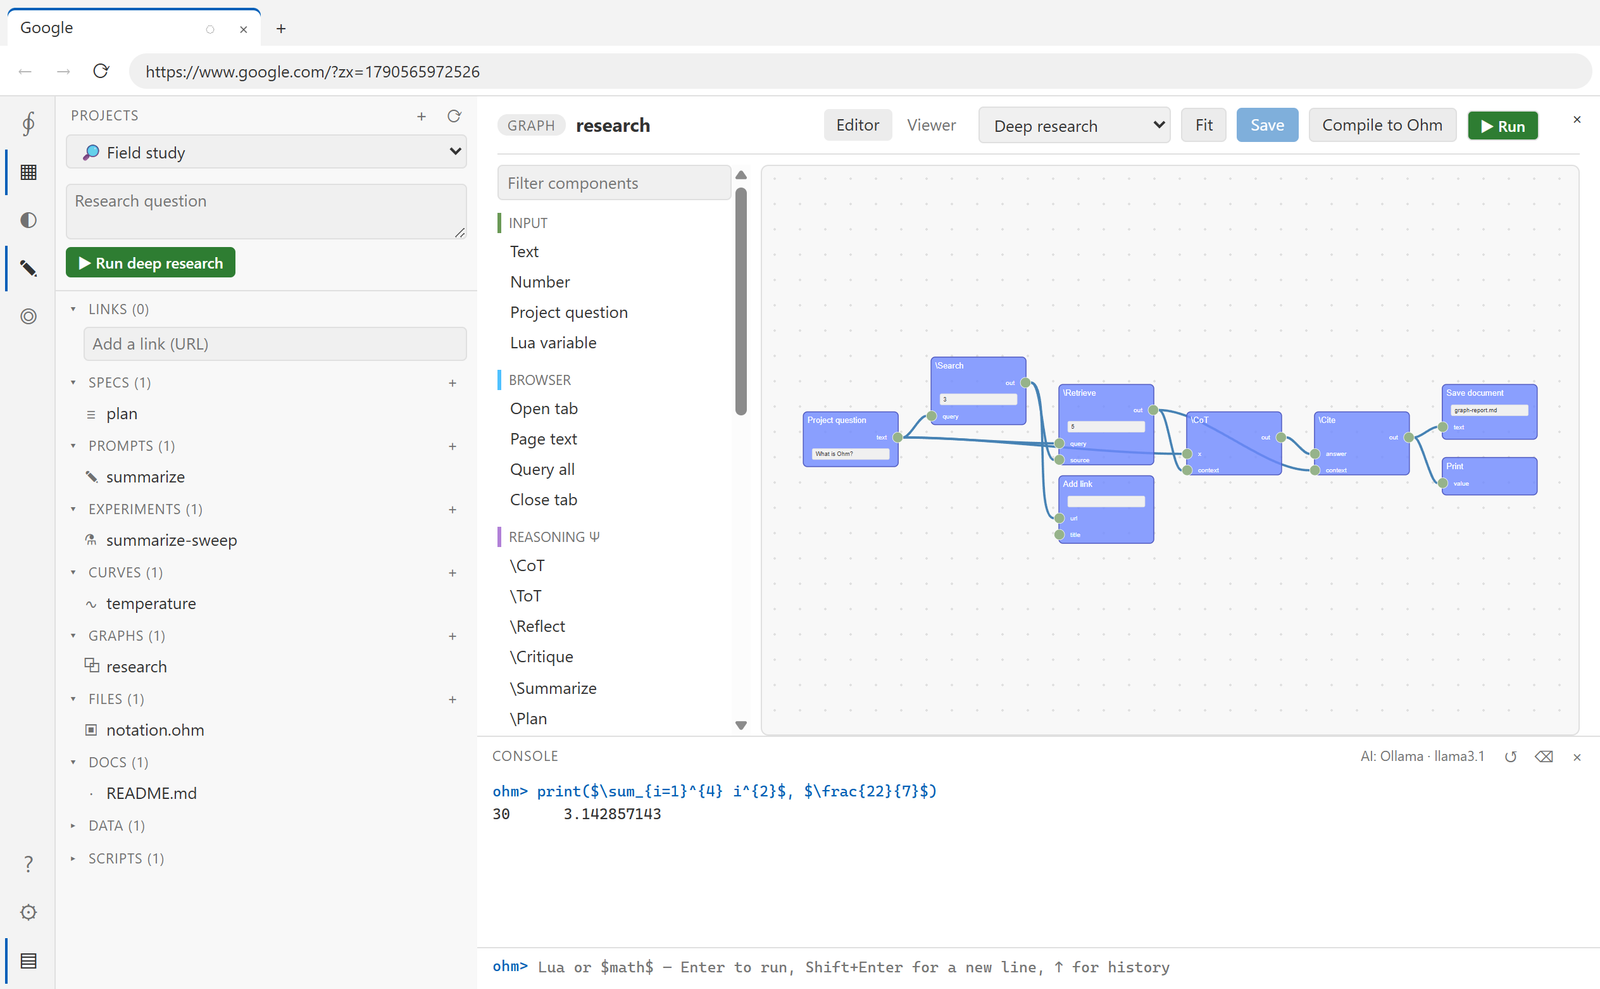
Components by category:
| Category | Components |
|---|---|
| input | Text, Number, Question (the project's research question), Variable |
| browser | OpenTab, PageText, QueryAll, CloseTab |
| ai | Ask, Generate, Prompt (runs a project prompt) |
| reasoning Ψ | CoT, ToT, Reflect, Critique, Summarize, Plan, SelfAsk |
| context Γ | Search, Fetch, Retrieve, Compress, Ground, Cite |
| memory ℳ | MemRead, MemWrite |
| aggregate Σ | Join, Vote, Debate |
| agent Λ | ReAct, Verify |
| math | MathExpr, Curve |
| project | AddLink, SaveDoc |
| output | Print, Display |
| script | OhmCode — raw Ohm, for anything the palette does not cover |
An unconnected input falls back to the node's own control value, so a node with a sensible default needs no wire.
Profiles#
A profile filters the palette. Five are built in — All components, Deep research, Prompting, Browser automation, Math & curves — and you can tick your own set and save it under a name. Built-in profiles are read-only.
This keeps the palette manageable: a research graph does not need the math components in view.
Compiling and running#
Compile to Ohm shows the generated script and any errors:
-- Generated from graph "research" by the Ohm graph editor. Edits here are overwritten.
local n1text, n2out, n3out, n4out, n5out
-- #1 Project question
n1text = (ctx.project and project.info().question) or "What is Ohm?"
-- #2 \Search
n2out = $\Search_{\Gamma}(n1text; k=3)$
-- #3 \Retrieve
n3out = $\Retrieve_{\Gamma}(n1text; n2out, k=5)$
-- #4 \CoT
n4out = $\CoT_{\Psi}(n1text; n3out)$
-- #5 \Cite
n5out = $\Cite_{\Gamma}(n4out; n3out)$
Nodes are emitted in dependency order, with the initial order decided by position on the canvas (top to bottom, then left to right) — so a tidy layout produces stable output. The comment numbers follow document order, so they can look out of sequence.
Compilation never throws. It reports problems instead:
- a component type that no longer exists,
- a required input with no connection and no control value,
- a cycle (the nodes in it are skipped).
Run refuses while there are errors. Otherwise it writes
projects/<id>/scripts/<name>.graph.ohm and runs that file — so the generated script stays
on disk, ready to open in the editor, tweak and run by hand.
Viewer mode#
Toggle to Viewer for a read-only canvas: connections cannot be changed and nodes cannot be dragged. Useful for reviewing a pipeline without disturbing it.